|
Case Study: Airline Model Types |
|||||||||||||||||||||||||||
|
|
This case study shows three ways to model business activity, from very simple to very complex. These examples use United Airlines quarterly data for its domestic division, from 1996 Q1 through 2004 Q1. Part 1: A
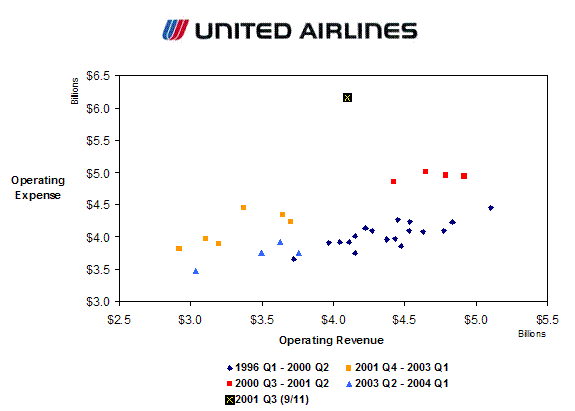
Simple Cost Control Example The first example simple relates operating expense to operating revenue, showing how costs are related to revenue. Part 2: Using
a Non-Financial Driver to Model Revenue and Expense The second example relates both operating revenue and operating expense to a demand-related driver – the number of revenue passengers enplaned. Part 3: Modeling
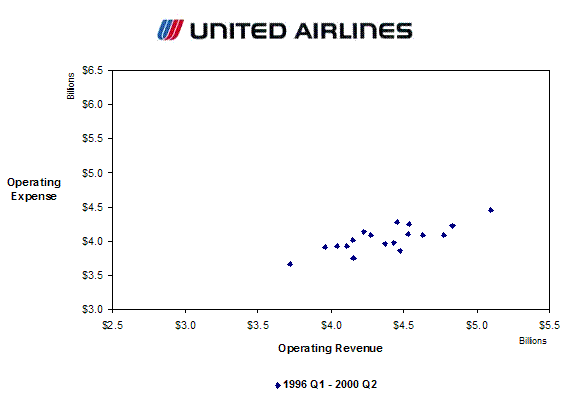
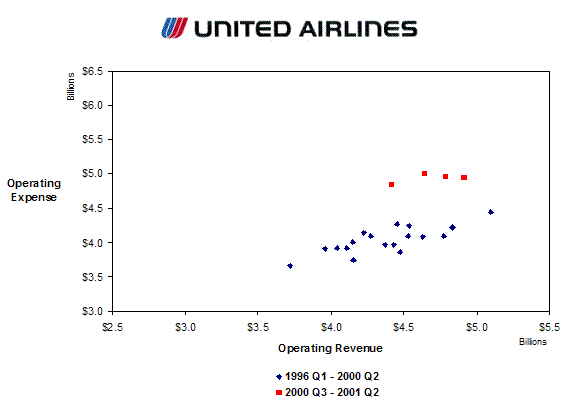
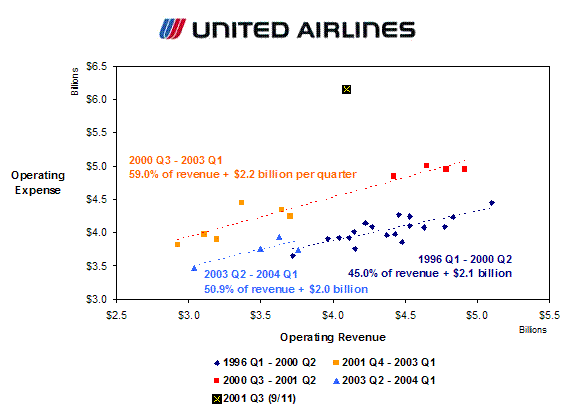
with Non-Financial Measures The third example also starts with revenue passengers enplaned, but includes additional operating measures that affect operating revenue and operating expense. Part 1: A Simple Cost Control ExampleFrom 1996 into 2000, United showed a fairly consistent relationship between revenue and expense.
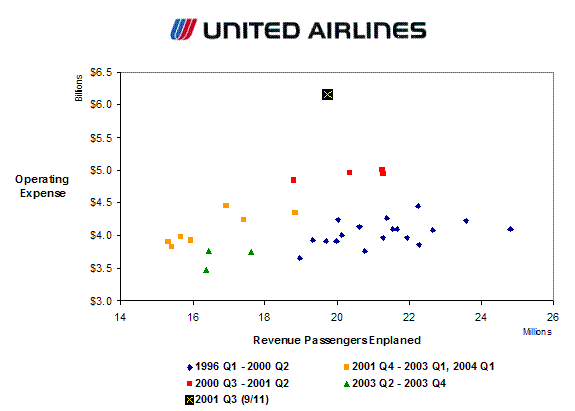
Following the wage rate increases in the first part of 2000, operating expenses jumped.
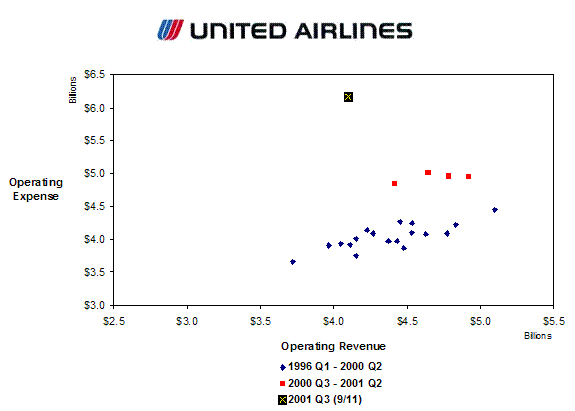
9/11 had a major impact on the third quarter of 2001, although only three weeks of the quarter were affected.
The impact of 9/11 on expense behavior was limited to that quarter, however, as expenses returned to the pattern established after the wage rate increase in 2000. The primary impact of 9/11 was in reduced demand, as revenue fell below 1996 levels.
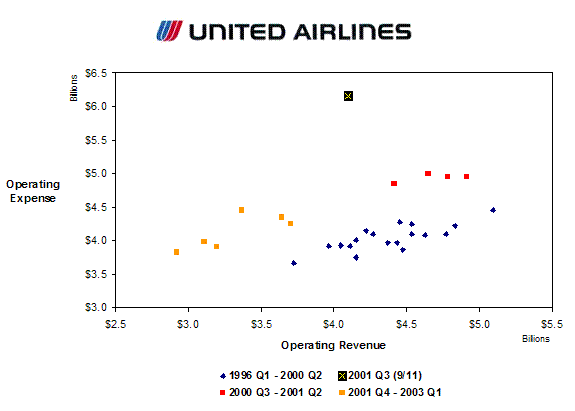
Following the wage concessions in 2003, United expense behavior returned to the pre-2000 pattern.
Analysis shows the wage increase cost 14.0% of revenue plus $100 million per quarter. After the 2003 wage concession, expenses took only 5.9% more of revenue (less $1000 million per quarter) compared to the pre-wage-increase behavior, making it much closer to the earlier pattern. While this analysis is quite successful in relating operating revenue and operating expense, more detailed analysis is required to examine revenue growth. Part 2: Using a Non-Financial Driver to Model Revenue and ExpenseBoth revenue and expense are typically driven by something else. This driver (or drivers) generates revenue but also drives costs. Let’s look at one possible driver, revenue passengers enplaned.
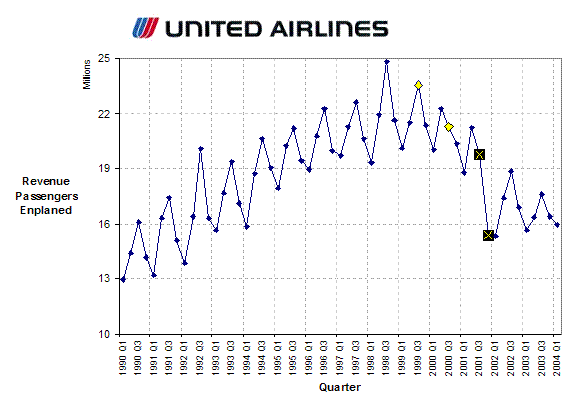
Revenue passengers enplaned shows classic seasonality and trend characteristics. The third quarter is the strongest, while the first quarter is the weakest. United showed strong growth during the 1990s, into 1998. In 1999, however, quarter 3 was significantly below the prior year, the first time this had happened since the recession in the early 1990s. In 2000, the third quarter was actually below the second quarter, a remarkable drop. Then 9/11 occurred, dropping passenger counts to early 1990s levels.
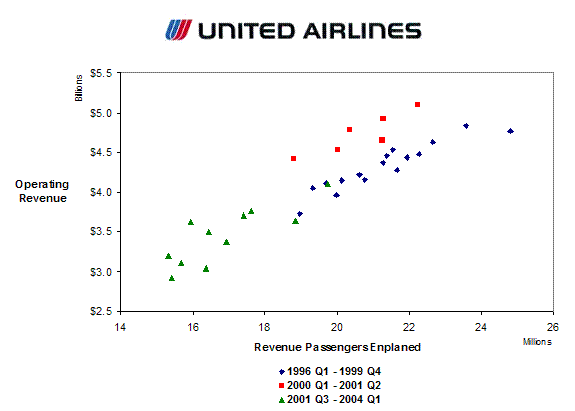
When we relate operating revenue to revenue passengers enplaned, we can identify three distinct periods of behavior. A strong relationship existed from 1996 through 1999. In 2000, however, the relationship jumped, and remained higher for six quarters. This suggests some kind of price increase occurred around this time, which would be consistent with the declines in passenger volume. In 2001 Q3 the relationship dropped back down to about the earlier levels, although there has been greater volatility.
The relationship of expense to revenue passengers enplaned is similar in pattern to the relationship to revenue discussed in part 1 (above). Part 3: Modeling with Non-Financial MeasuresRevenue and expense are affected by more than just number of passengers. How much passengers pay and how far they fly, for example, will affect how much revenue is earned and how much expense is generated. Revenue
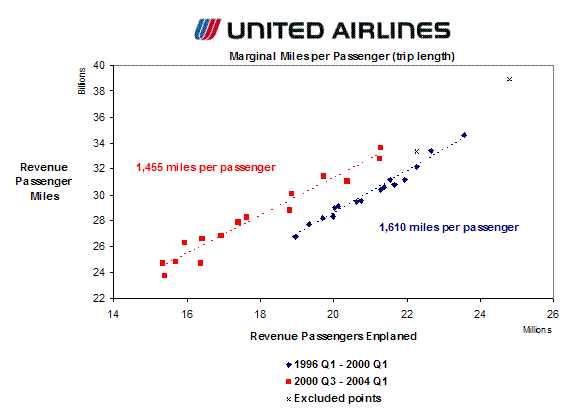
There is a clear, consistent relationship between passengers and passenger miles. In United’s case, this relationship changed in 2000 Q3, when the average trip increased (within the range of passengers currently being carried), but the marginal trip length (the distance each additional passenger traveled) declined.
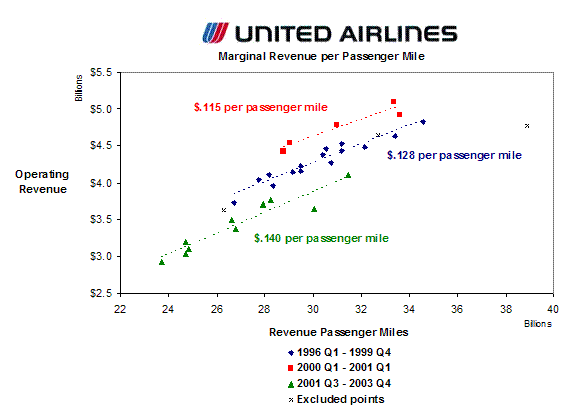
There are three distinct periods in the relationship of revenue to passenger miles. Average price did increase in early 2000, but fell below the old relationship in mid-2001. Expense
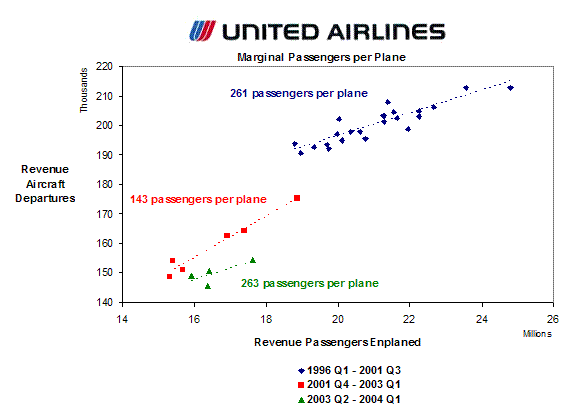
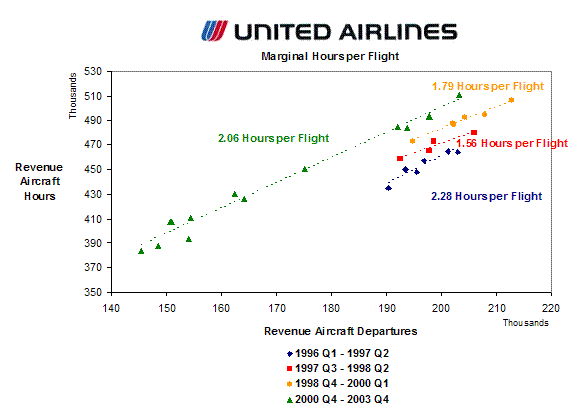
There are also three distinct periods in the relationship of the number of departures required to carry the passengers. Both the average and marginal passenger values changed in these periods. This may have been due to changing demand patterns and/or to changes in flight schedules.
Average flight length (in hours) has shown a steady increase.
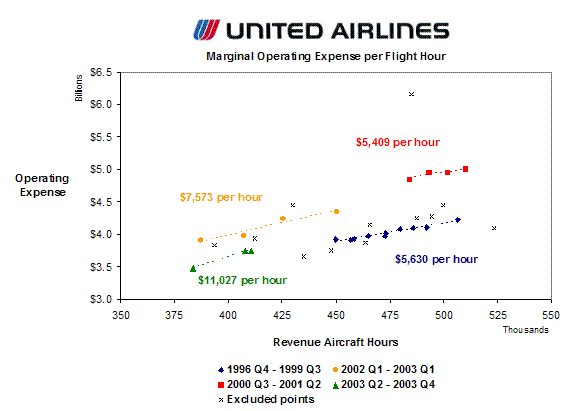
Cost per flight hour mimics the pattern seen earlier, which is driven by the wage changes discussed above. By including these additional factors, the impact of performance in many different parts of the operation can be modeled and quantified. These measures become key performance indicators, and target levels can be set to optimize enterprise value. |
||||||||||||||||||||||||||
|
|
|||||||||||||||||||||||||||
|
|
|||||||||||||||||||||||||||
|
|
|||||||||||||||||||||||||||
|
|
|||||||||||||||||||||||||||
|
|
|||||||||||||||||||||||||||
|
|
|||||||||||||||||||||||||||
|
|
|||||||||||||||||||||||||||
|
|
|||||||||||||||||||||||||||
|
|
|||||||||||||||||||||||||||
|
© 2004 Thinking Links, LLC All rights reserved. |
|||||||||||||||||||||||||||