|
Case Study: Airline Revenue Passengers Enplaned |
|||||||||||||||||
|
|
In the airline industry, one of the key drivers of revenue is the number of passengers, or “revenue passengers enplaned”. Airline passenger counts are very seasonal, and trends have been changing, especially in recent years. Here is an example of how Performance Chain™ can take a complex time series and decompose it into its simple parts, making it easy to analyze and forecast. These charts show monthly data for domestic operations only. Total Revenue Passengers Enplaned is decomposed into: ·
Events ·
Trend Total Revenue Passenger Enplaned
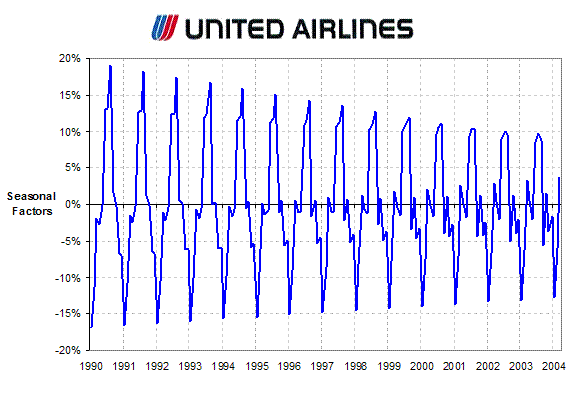
These airlines experienced different growth trends during this period. Each were significantly affected by 9/11 and its aftermath. Seasonality appears to be similar but not exactly the same between airlines. Seasonality
When we break out seasonality, we can see that the patterns are similar between companies, but not exactly the same. More interesting is the change of seasonality over time, as American and United have moved closer to Southwest’s pattern. United has seen its seasonality become much less extreme. The chart below overlays the seasonality of each company.
Events
The most notable event during this time period was 9/11, when two American and two United jets were hijacked and crashed. All three airlines saw an immediate and prolonged drop in passenger counts as a result of this event. American experienced the largest monthly impacts, but United saw the longest impact, as late as April 2002. Southwest had the smallest and shortest impact. Of course, 9/11 also had a longer-term impact on trends (see below). Random Variation
Random variation has been fairly consistent over this time period, generally falling within +/-5% each month. There are a few instances of extreme or one-sided values (American and United in 1992, for example) that should be investigated for possible events (e.g. the recession). Trend
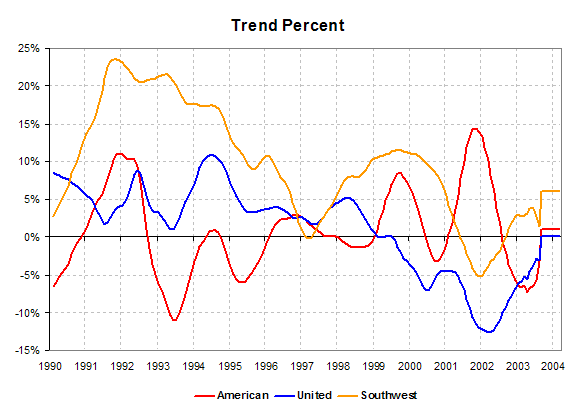
This chart shows the passenger counts with seasonality, events, and random variation removed. Now it is very easy to see changes in trends, and it is also very easy to forecast expected trends. The charts below show percent change in this trend from the prior period (note that we do not need to compare to prior year, since seasonality has been removed).
American showed something of an upward, but erratic, trend during the 1990s.
United’s growth turned negative in early 1999. They have been particularly affected by the recession and 9/11.
Southwest experiences very strong growth in the early 1990s, but that ended in 1996. It started to grow again in the late 1990s, bu the recession and 9/11 took it into negative growth for about a year. It is now back in positive territory. Here are the three percent change in trend lines overlaid:
Conclusion Even with straight-forward examples such as airline passenger counts, there are numerous performance indicators that are obscured because so many factors are combined into one number. Decomposing the total into its parts allows each factor to be evaluated and forecast individually. This makes analysis and forecasting easier and more accurate. |
||||||||||||||||
|
|
|||||||||||||||||
|
|
|||||||||||||||||
|
|
|||||||||||||||||
|
|
|||||||||||||||||
|
|
|||||||||||||||||
|
|
|||||||||||||||||
|
|
|||||||||||||||||
|
|
|||||||||||||||||
|
|
|||||||||||||||||
|
© 2004 Thinking Links, LLC All rights reserved. |
|||||||||||||||||